
Your whole reputation, on one dashboard.
A reputation dashboard shows your average rating, review volume, response rate and response time in one live view, per location or rolled up across the group, with monthly reports that generate and share themselves.
Free forever for Google · No card required · Built for service businesses everywhere
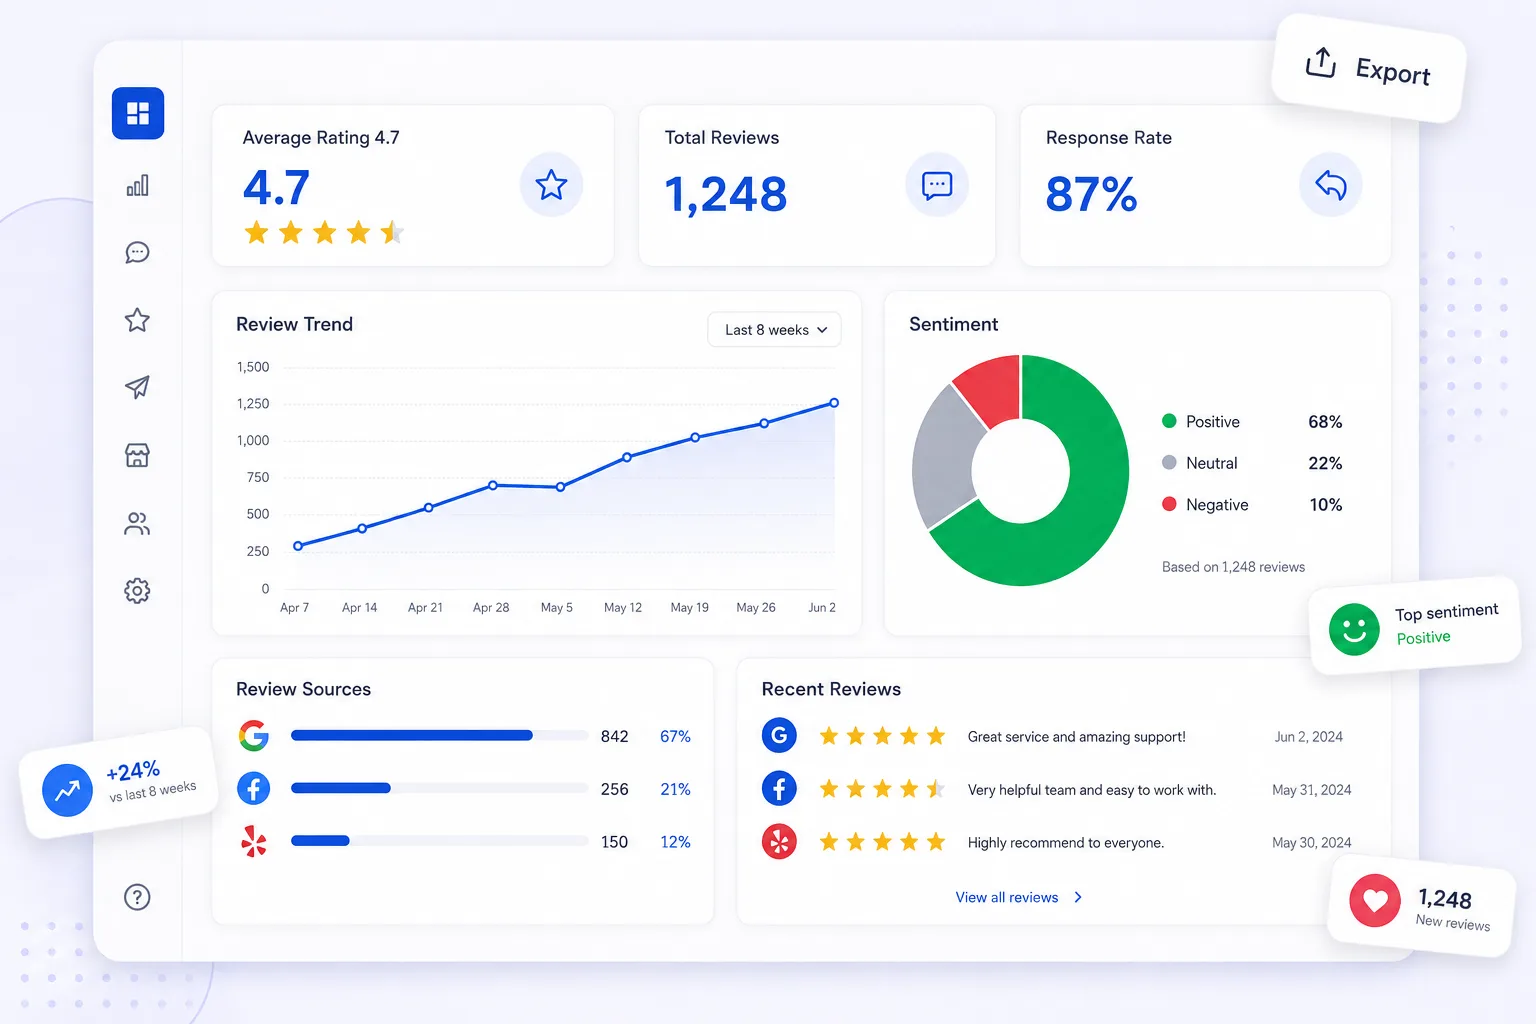

You can’t improve what you can’t see.
Most owners know their star rating and nothing else. Whether reviews are speeding up or slowing down, whether anyone is actually replying, whether one branch is quietly dragging the group average. Those questions need numbers, and pulling them by hand from four platforms is a job nobody does twice.
No single view
Performance is split across platforms and locations.
Manual reporting
Pulling monthly numbers by hand eats time and gets skipped.
Unclear priorities
Without trends, it’s hard to know if you’re getting better.
One dashboard, always current.
Connect sources
Reviews and ratings flow in automatically.
See the metrics
Average rating, volume, response rate and time, updated live.
Share the report
Send owners and managers a clear monthly summary.
The numbers that run your reputation.
The dashboard answers the four questions that matter: how good are we, how many are coming in, how many are we answering, and how fast. Each is shown over time rather than as a snapshot, because the direction of travel is the useful part. A 4.6 climbing from 4.2 and a 4.6 sliding from 4.9 are entirely different businesses.
- Live key metrics
- Per-location & rolled-up views
- Response rate & time tracking
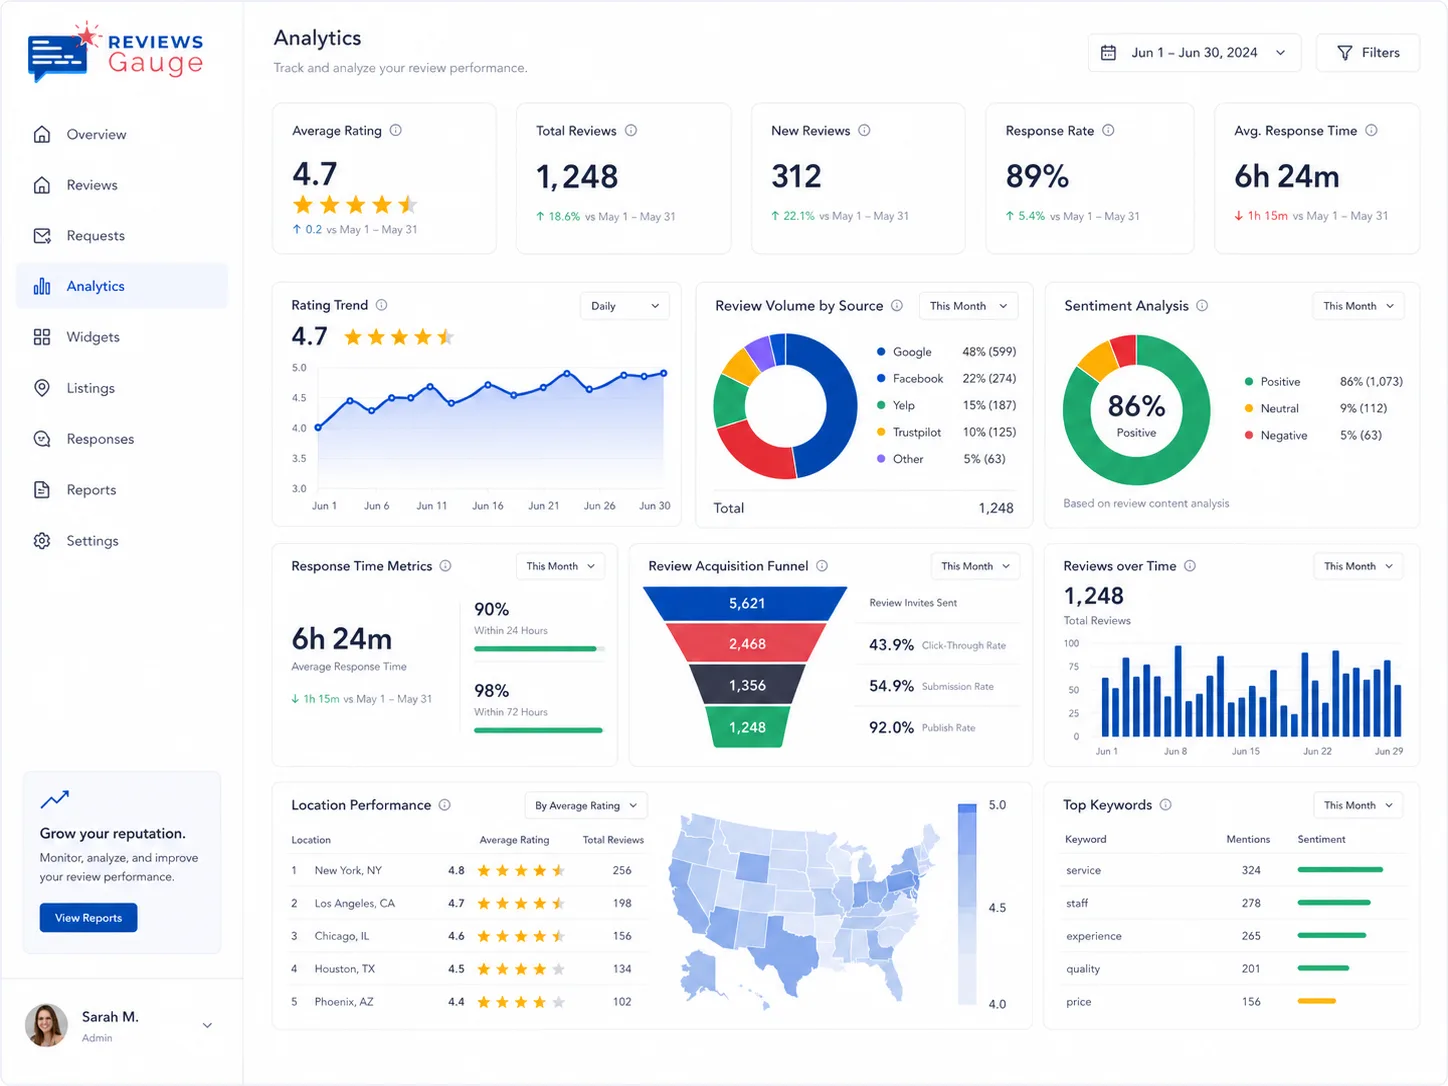
Reports people actually read.
Monthly reports are generated automatically and built to be shared, which turns reputation from something the owner keeps an eye on into something a team can be accountable for. For multi-site groups the same numbers appear per location, so a regional conversation can be about evidence rather than impressions.
- Automated monthly reports
- Clear, owner-friendly format
- Export and share
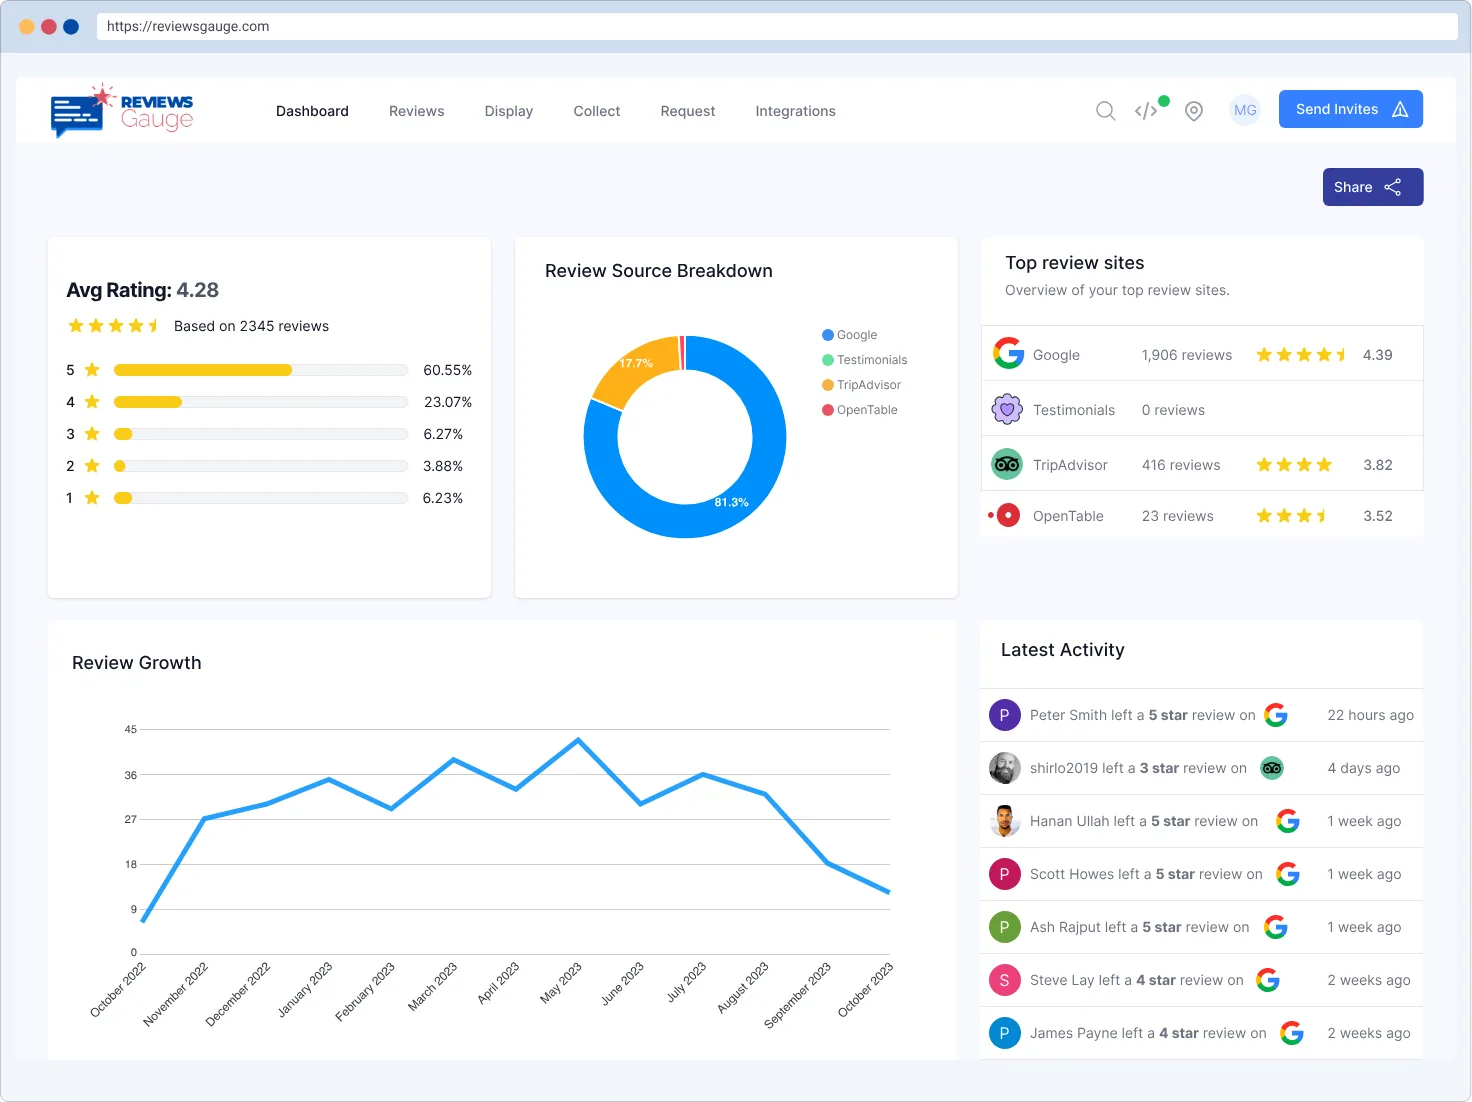
Reporting without the busywork.

Live dashboard
Every key metric in one view.

Multi-location
Compare and roll up across sites.

Auto reports
Monthly summaries, sent on their own.
Better together.

Who uses reports & dashboard.
Franchises · E-commerce & Retail · Legal & Professional · Fitness & Gyms · Yoga Studio · Home Services
Further reading: Podium alternatives: what to look at, and when to stay · Birdeye and Podium pricing: what to expect, and what to ask · Reputation management agency or software: which do you actually need?
Reports & Dashboard, answered.
What metrics does the dashboard show?
Can I report on multiple locations?
Are reports automated?
What does the reputation dashboard actually show?
Can I report on multiple locations?
Are the reports automated?
Can I share reports with people who do not use the software?
What is a good response rate to aim for?
How is response time measured?
Can I see how this month compares to last?
Last updated